Abnormal component analysis#
Sample usage of abnormal component analysis for dimension reduction.
[1]:
from depth.model.DepthEucl import DepthEucl
import numpy as np
from matplotlib import pyplot as plt
[2]:
## Creating dataset and samples
np.random.seed(2801)
mat1=[[1, 0, 0, 0, 0],[0, 1, 0, 0, 0],[0, 0, 1, 0, 0],[0, 0, 0, 1, 0],[0, 0, 0, 0, 1]]
mat2=[[0.25, 0, 0, 0, 0],[0, 0.25, 0, 0, 0],[0, 0, 0.25, 0, 0],[0, 0, 0, 0.25, 0],[0, 0, 0, 0, 0.25]]
mat3=[[0.5, 0, 0, 0, 0],[0, 0.5, 0, 0, 0],[0, 0, 0.5, 0, 0],[0, 0, 0, 0.5, 0],[0, 0, 0, 0, 0.5]]
data1 = np.random.multivariate_normal([0,0,0,0,0], mat1, 980)
data2 = np.random.multivariate_normal([7.5,7.5,0,0,0], mat2, 10)
data3 = np.random.multivariate_normal([0,0,0,5,5], mat3, 10)
dataset=np.concatenate((data1,data2,data3),axis=0)
Create model and load dataset for depth computation
[3]:
model=DepthEucl().load_dataset(dataset)
baseACA=model.ACA(dim=2,) # evaluate the dataset itself
[4]:
datasetACA=np.dot(dataset,baseACA)
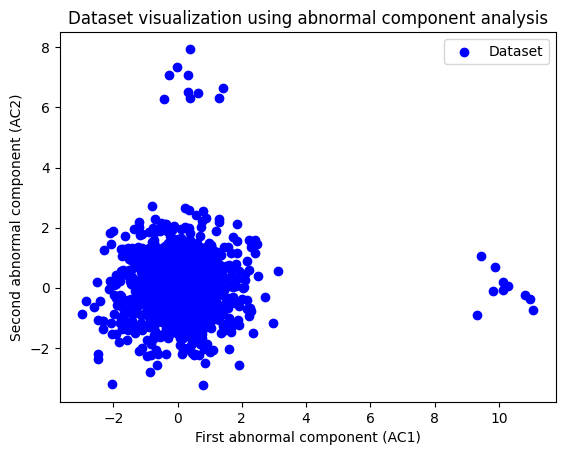
fig=plt.figure()
plt.scatter(datasetACA[:,0],datasetACA[:,1], c="blue",label="Dataset")
plt.xlabel("First abnormal component (AC1)")
plt.ylabel("Second abnormal component (AC2)")
plt.title("Dataset visualization using abnormal component analysis")
plt.legend()
plt.show()