Continuous modified explected convex hull depth#
Sample usage of continuous modified explected convex hull computation. It will plot samples and dataset based on continuous modified explected convex hull values.
[1]:
from depth.model.DepthEucl import DepthEucl
import numpy as np
from matplotlib import pyplot as plt
[2]:
## Creating dataset and samples
np.random.seed(2801)
mat1=[[1, 0],[0, 2]]
mat2=[[1, 0],[0, 1]]
X = np.random.multivariate_normal([1,1], mat2, 10)
dataset = np.random.multivariate_normal([0,0], mat1, 100)
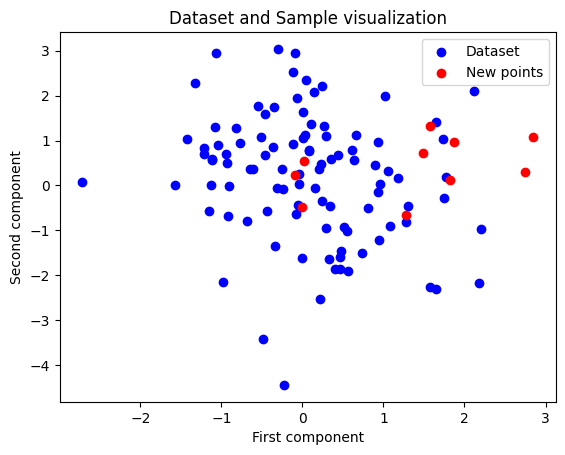
## visualize points
fig=plt.figure()
plt.scatter(dataset[:,0],dataset[:,1], c="blue",label="Dataset")
plt.scatter(X[:,0],X[:,1], c="red",label="New points")
plt.xlabel("First component")
plt.ylabel("Second component")
plt.title("Dataset and Sample visualization")
plt.legend()
plt.show()
Create model and load dataset for depth computation
[3]:
model=DepthEucl().load_dataset(dataset)
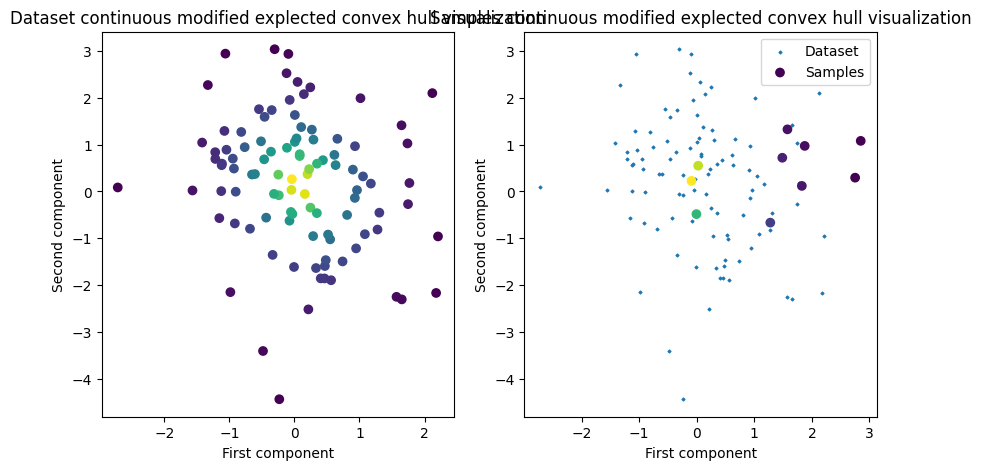
depthX=model.cexpchullstar(X,output_option="lowest_depth") # Compute X Depth w.r.t. the dataset
depthDataset=model.cexpchullstar(evaluate_dataset=True,output_option="lowest_depth") # evaluate the dataset itself
fig, (ax1,ax2)=plt.subplots(1,2,figsize=(10,5))
ax2.scatter(dataset[:,0],dataset[:,1],s=2, label="Dataset",marker="D")
for x, depth, name, ax in zip([dataset,X],[depthDataset,depthX],
["Dataset", "Samples"],[ax1,ax2]):
ax.scatter(x[:,0],x[:,1], c=depth,label=name)
ax.set_xlabel("First component")
ax.set_ylabel("Second component")
ax.set_title(f"{name} continuous modified explected convex hull visualization")
ax2.legend()
plt.show()
x value is set to the loaded dataset